Hydrogen Production Emissions Calculator
The Hydrogen Production Emissions Calculator (HyPEC) webtool allows users to quickly estimate the carbon intensity of hydrogen production for a range of low-carbon hydrogen technologies – technologies which are still in the early stages of development and deployment, and for which achievable performance is still evolving. This webtool offers the flexibility to evaluate the carbon footprint of these technologies under varying assumptions. The Technical Approach underpinning this webtool delivers results based on calculations that leverage output values from the GREET (2021 version) life cycle analysis model developed by Argonne National Laboratory. For help with terms and inputs, read about the tool here. ?
This chart shows the carbon intensity of three different hydrogen production pathways in terms of kilograms of carbon dioxide equivalent (CO₂ₑ) emitted per kilogram of hydrogen (H₂) produced.
The HyPEC webtool performs calculations based on results from GREET (GREET1 excel version 2021) and user input values entered into the webtool. GREET calculations were performed for 14,832 cases covering a wide range of values for available input parameters in GREET to produce a database of results that includes production factors, emission factors, and stream intensities (for example, the carbon intensity of electricity delivered to the hydrogen production facility). For a set of user input values, the webtool retrieves relevant information from the database of GREET results and performs calculations with the user inputs (some of which differ from the normally available input variables in GREET version 2021) to generate the carbon intensity values reported in the chart. ? While the webtool results agree closely with GREET, there are minor variances. A comparison of the 14,832 cases in the database showed that the webtool results matched GREET identically for many cases and agreed to within 0.21% (within 0.01 kg CO₂ₑ/kg H₂) across all cases. See the Technical Documentation for more details.
Hydrogen Production Emissions Calculator (HyPEC) Version 1.02 version log
| AEO | Annual Energy Outlook |
| CH₄ | Methane |
| CO₂ | Carbon Dioxide |
| CO₂ₑ | Carbon Dioxide Equivalents |
| EIA | Energy Information Administration |
| GREET | Greenhouse Gases, Regulated Emissions, and Energy Use in Technologies Model |
| GWP | Global Warming Potential |
| H2A | Hydrogen Analysis |
| HYPEC | Hydrogen Production Emissions Calculator |
| IEA | International Energy Agency |
| IRENA | International Renewable Energy Agency |
| N₂O | Nitrous Oxide |
| NREL | National Renewable Energy Lab |
| SMR | Steam Methane Reformer |
| WTG | Well-to-Gate |
| WTW | Well-to-Well |
Changes made to these global inputs will be applied to all technologies.
Inputs available in the webtool are defined relative to their corresponding relationship with GREET as follows:
GREET is a sophisticated life cycle analysis tool with an expansive set of input parameters. This webtool gives users the ability to adjust input parameters that have significant influence the carbon footprint for hydrogen production from electrolysis, steam methane reforming, and biomass gasification. Unless otherwise stated, the input parameters used to generate results for this webtool are set to their default values in GREET. This webtool also provides users with the ability to adjust input parameters that are not normally available in GREET, such as custom energy consumption and carbon capture rates. See the Technical Documentation for details.
The system boundary in the webtool is from well-to-gate (WTG) as shown in the figure below. This includes emissions associated with (1) producing the required feedstock and energy (e.g., natural gas, electricity, or biomass), (2) transporting the feedstock material and energy to the hydrogen production plant, (3) generating the hydrogen at the plant, (4) transporting the hydrogen to an end use location, such as a hydrogen vehicle refueling station, and (5) compressing the gaseous hydrogen up to conditions suitable for hydrogen vehicle refueling (GREET assumes 14,000 psia, or 965 bar).
The webtool offers the option of including the emissions associated with the construction of associated energy feedstock infrastructure. This includes:
The emissions associated from this infrastructure construction activity are based on emission factors for constructions materials estimated in the GREET model. Although some fuels affected by the inputs above have no direct use in the hydrogen production pathways being analyzed (e.g., petroleum-based fuels), they can have indirect effects on the feeds/fuels being used. GREET version 2021, which this webtool leverages, does not include emissions associated with construction of infrastructure for hydrogen production plants – accordingly, this webtool does not include such associated emissions.
Land use changes associated with biomass feedstock production can lead to additional impacts on greenhouse gas emissions. GREET version 2021, which this webtool leverages, does not include land use change impacts for the wood feedstocks (poplar and willow) used in this webtool. While GREET version 2021 does include land use change impacts with changing land use from food crop production to switchgrass production, these changes only impact the ethanol production pathway in GREET, and as such, they do not have any discernible impact on the hydrogen production pathways in GREET. Hence, for the biomass feedstocks considered here, land use change impacts for hydrogen production are not directly included in GREET version 2021 and are therefore not included in this webtool. See the Technical Documentation for further information.
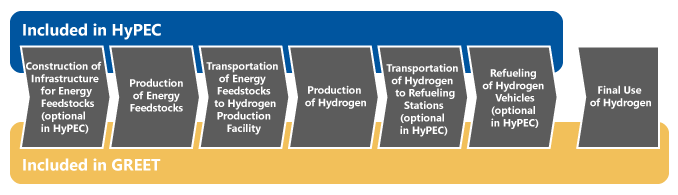
By default, GREET includes emissions associated with transporting hydrogen over a distance of 750 miles from the production location to an end-use facility. Additionally, by default, GREET assumes that the hydrogen is delivered to vehicle refueling stations that compress hydrogen to high pressure (14,000 psia). This webtool provides the flexibility to independently choose whether to include hydrogen transportation and/or compression for refueling stations.
Global Warming Potentials (GWP) account for the relative difference in the warming impact between different greenhouse gases. GWPs are multipliers to convert the grams of a given greenhouse gas species to the equivalent grams of CO₂ (CO₂e) in terms of global warming impact.
GREET includes the greenhouse gases of carbon dioxide (CO₂), methane (CH₄), and nitrous oxide (N₂O). Hydrogen (H₂) is not included as a greenhouse gas in GREET Version 2021, which this webtool leverages.
GWPs are dependent on the time horizon evaluated. A 100-year GWP represents the climate impact of a greenhouse gas over 100 years and is the default time horizon in GREET. GREET includes the option to evaluate a 20-year GWP time horizon, which characterizes the climate impacts of a gas over a 20-year period.
The GWP values have evolved with improved scientific understanding as summarized over the years in the different IPCC Climate Assessment Reports. GREET default values are based on the IPCC Fifth Assessment Report (5AR) GWP values. See the Technical Documentation for further information.
The emission intensity of electricity is widely variable depending upon the electricity generation method. This tool allows selection of predefined electricity grid mixes or individual electricity generation methods. The predefined electricity mixes available to be selected in the webtool are summarized in the table below.
The default electricity mix in GREET is based on the U.S. Energy Information Administration’s (EIA) 2020 values, and GREET includes options for EIA Annual Energy Outlook estimates in years 2030 and 2050 as well (“Reference”). Users can also select a single generation source – such as solar, natural gas, and nuclear – or enter a user-defined mix of generation sources. This webtool provides the option to select estimates from NREL’s Electrification Futures Study (EFS) for the “High Electrification – Low Cost Renewables” and “High Electrification – Emission Constraints” scenarios. These two scenarios are specifically designed to evaluate the potential for rapid and large-scale adoption of low-carbon electricity generation. In contrast, the EIA Annual Energy Outlook “Reference” scenarios are based on business-as-usual projections of the future U.S. electric mix. Therefore, as indicated in the table above, the NREL Electrification Futures Study scenarios yield much greater shares of renewable electricity in comparison to the EIA AEO projections. See the Technical Documentation for further information.
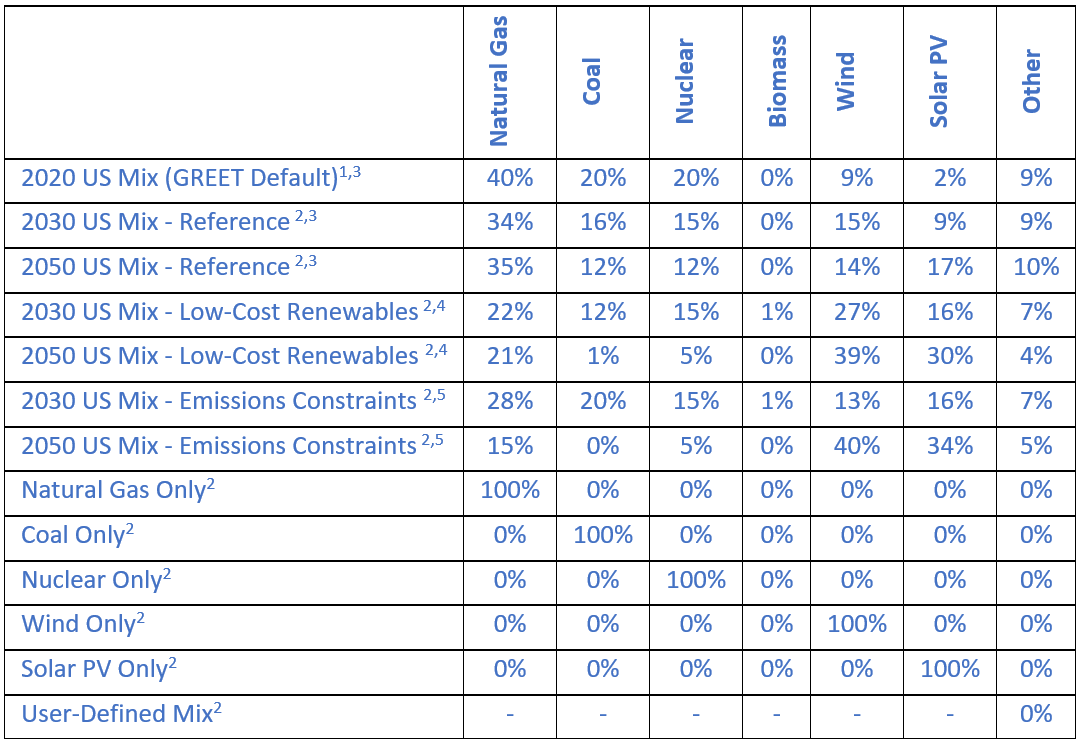
1 Default electricity mix in GREET
2 Electricity mix is entered as a user-defined GREET input
3 Electricity mix based on EIA Annual Energy Outlook
4 Electricity mix based on NREL Electrification Futures Study – Low Renewable
Energy Cost,
High Electrification Scenario
5 Electricity mix based on NREL Electrification Futures Study – Emissions
Constraints,
High Electrification Scenario
Methane slip, or leakage, refers to unburned methane that escapes at different points in the natural gas supply chain, including production sites, storage, transmission, and distribution. While methane slip varies significantly between individual geographies and segments across the supply chain, in GREET, the default supply-chain wide value of 0.99% as based on a top-down/bottom-up, hybrid approach. GREET includes the option to use a supply-chain wide value of 0.70% as based the EPA inventory of U.S. greenhouse gas emissions and sinks bottom-up approach. In both GREET and this webtool, a user-defined methane slip value can also be entered.
Methane leakage will affect all pathways involving natural gas, such as electricity generation from natural gas, or other industrial and chemical processes where natural gas is used. Measurement and characterization of methane emissions is an important and evolving area (learn more). See the Technical Documentation for further information.
Changes made to these technology-specific inputs only apply to the technology corresponding to the given input parameter. These inputs include energy consumption factors, CO₂ capture rates, and/or feedstock type.
Inputs available in the webtool are defined relative to their corresponding relationship with GREET as follows:
GREET is a sophisticated life cycle analysis tool with an expansive set of input parameters. This webtool gives users the ability to adjust input parameters that have significant influence on the carbon footprint for hydrogen production from electrolysis, steam methane reforming, and biomass gasification. Unless otherwise stated, the input parameters used to generate results for this webtool are set to their default values in GREET. This webtool also provides users with the ability to adjust input parameters that are not normally available in GREET, such as custom energy consumption and carbon capture rates.See the Technical Documentation for details.
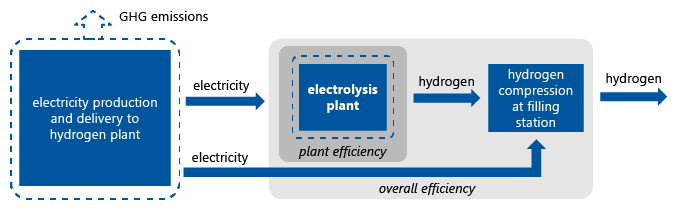
Electricity is used to power the electrolyzer stack and ancillary units in an electrolysis plant. Additional electricity is used to compress the hydrogen for downstream transmission and storage of hydrogen. GREET defaults to 1.497 Joule of electricity consumed per Joule of hydrogen produced (lower heating value basis) in the electrolysis process, corresponding to a plant efficiency of 67% = [1/1.497]. Including the electricity required for transmission (0.033 J per joule of hydrogen, assuming 750 miles) and compression (0.102 Joule of electricity per joule ofoverall hydrogen to compress to 96.5 MPa required for hydrogen fuel cell vehicle fueling stations) the overall efficiency is 63% [= 1/(1.497 + 0.033 + 0.102)]. See the figure below for definitions of the plant efficiency and overall efficiency.
Electrolyzer technologies are evolving, and correspondingly, so is the energy consumption required for electrolysis plants. Reports from IEA and IRENA provide an overview of electrolysis technologies and their estimated performance. See the Technical Documentation for further information.
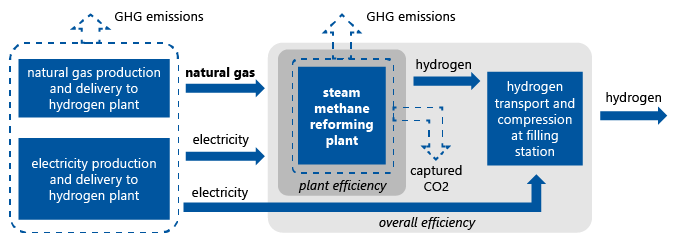
Natural gas is consumed in a steam methane reforming (SMR) facility as both a feedstock and energy source. For the H2A SMR plant option in GREET that is used for this webtool, the default is 1.371 Joule natural gas consumed per Joule hydrogen produced (lower heating value basis). An additional 0.017 Joule of grid electricity is consumed per Joule of hydrogen at the facility, translating to a plant efficiency of 72% [= 1 / (1.371 + 0.017) ]. Including the electricity required for transmission (0.033 J per Joule of hydrogen to transport 750 miles) and compression (0.102 Joule of electricity per joule of hydrogen to compress to 96.5 MPa for hydrogen fuel cell vehicle fueling stations) the overall efficiency is 66% [ = 1 / (1.371 + 0.017 + 0.033 + 0.102) ]. For plants with carbon capture, additional grid electricity is consumed in the amount of 349 Joule per gram of CO₂ capture [ plant efficiency = 1 / (1.371 + 0.017 + electricity for CO₂ capture) ].
While SMR technology is mature, plants that integrate carbon capture are still in the early stages of development and deployment, such that the technology is evolving. Correspondingly, the natural gas and electricity consumption required for these plants is evolving. Reports from IEA and others provide an overview of SMR technology with and without carbon capture, and its estimated performance. See the Technical Documentation for further information.
The default CO₂ capture rate in GREET is 0% (no CO₂ capture). This webtool is based on the H2A SMR plant configuration in GREET, which offers the option to evaluate a CO₂ capture rate of 90%. The webtool allows the user additional flexibility to adjust the CO₂ capture rate to a custom, user-defined value as a way of evaluating the impact on overall GHG emissions.
This webtool uses the H2A configuration to represent the SMR technology as this is the option in GREET which enables evaluation of plants with carbon capture (rather than using the default “industry” configuration in GREET, which does not provide an option to evaluate carbon capture). While GREET only has the option to evaluate a capture rate of 90% (or 0%), SMR plants that integrate carbon capture are still in the early stages of development and deployment such that the technology is evolving. Correspondingly, the achievable carbon capture rate for these plants is evolving. Reports from IEA and others provide an overview of SMR technology with and without carbon capture, and its estimated performance. “See the Technical Documentation for further information.
The type of biomass used as a feedstock to the gasification plant impacts the overall emissions profile as the upstream life cycle emissions associated with production and transportation varies across different biomass feedstock types. This webtool allows users to choose between the following biomass options, which are included in GREET: willow, poplar, or switchgrass.
The carbon content of biomass is of biogenic origin (absorbed from atmosphere during plant growth) and is thus considered renewable. Gasification plants can be configured to capture and sequester carbon emissions. Such gasification configurations result in lower life cycle carbon emissions. Moreover, it is possible for biomass gasification to achieve net-negative emissions, as the carbon captured from the facility was originally removed from the atmosphere during the growth cycle of the biomass. All biomass types are collected at 40 wt% moisture prior to transportation to the gasification facility. See the Technical Documentation for further information.
Biomass is consumed in a gasification facility as both a feedstock and energy source. For hydrogen production via biomass gasification, the default rate of biomass consumption in GREET is 2.227 Joules of biomass consumed per Joule of hydrogen produced (lower heating value basis). In GREET, the default plant also consumes an additional 0.029 Joules of natural gas and 0.016 Joules of electricity per Joule of hydrogen produced. Thus, default plant efficiency is 44% [ = 1 / (2.227 + 0.029 + 0.016) ]. Including the electricity required for transmission (0.033 J per joule of hydrogen to transport 750 miles) and compression (0.102 Joule of electricity per joule of hydrogen to compress to 96.5 MPa required for hydrogen fuel cell vehicle fueling stations), the overall efficiency is 42% [= 1 / (2.227 + 0.0293 + 0.016 + 0.033 + 0.102) ]. For plants with carbon capture, additional grid electricity is consumed in the amount of 349 Joule per gram of CO₂ capture [ plant efficiency = 1 / (2.227 + 0.029 + 0.016 + electricity for CO₂ capture) ].
Biomass gasification plants designed to produce hydrogen and capture carbon are still in the early stages of development and deployment, such that the technology is evolving. Correspondingly, the biomass, natural gas, and electricity consumption required for these plants is evolving. Reports from NREL (ref 1, ref 2) and GTI Energy provide an overview of gasification technology and its estimated performance. See the Technical Documentation for further information.
_Description.png)
The default CO₂ capture rate in GREET is 0% (no CO₂ capture). The webtool allows the user to adjust the CO₂ capture rate to a custom user-defined value as a way of evaluating the impact on overall GHG emissions.
Biomass gasification plants designed to produce hydrogen and capture carbon are still in the early stages of development and deployment, such that the technology is evolving. Correspondingly, the achievable carbon capture rate for these plants is evolving. Reports from NREL (ref 1, ref 2) and GTI Energy provide an overview of gasification technology and its estimated performance. See the Technical Documentation for further information.